



Capability in accordance with ISO 22514

Article by Christelle Guyot & Valérie Le Couedic
Moving from identifying defects to managing variations
Industrial performance is driven by a zero-defect standard: getting it right the first time. However, all manufacturing processes are subject to variations (the 5Ms). The challenge is not to eliminate this variability entirely, but to ensure that it remains within product specifications. This is precisely the purpose of capability studies: to answer the question : Is my process sufficiently controlled to reliably ensure that the parts produced meet specifications?
ISO 22514 provides a structured methodological framework for conducting these analyses, evaluating the performance of machines and processes, and effectively managing variability.
VIDEO

The machine’s inherent performance
Before evaluating a manufacturing process, it is essential to first analyze the machine’s intrinsic performance. The goal is to determine whether the machine is technically capable of meeting tolerances while minimizing its own sources of variation.
An analysis of machine performance is particularly relevant:
- upon receipt,
- to monitor wear over time,
- to schedule maintenance as needed,
- to help the design department establish realistic tolerances
To characterize this intrinsic performance, the study must be conducted under specific conditions: a single setup, a single batch of material, over a short period of time, and with a single operator. A minimum production run of 50 consecutive parts is often required (in the automotive industry, for example).
Two capability indices are calculated:
The Pm index assesses whether the machine’s dispersion is compatible with the tolerance, regardless of its centering.
The Pmk index assesses whether the machine is capable of producing parts that are both sufficiently centered on the nominal value and sufficiently tightly clustered to meet the tolerance, based on the most unfavorable limit.
To better understand the Pm and Pmk indices, we can compare a machine’s performance to shooting at a target:
- The target represents the tolerance that must be met
- The center of the target corresponds to the nominal value (the ideal performance)
- The marks on the target represent the measurements of the produced parts
Let’s examine the following three scenarios:
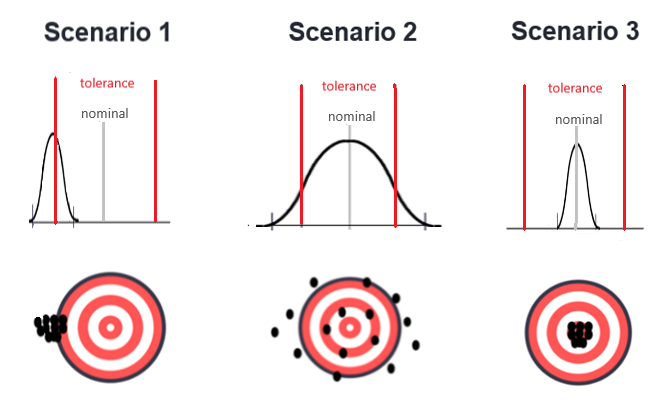
Scenario 1: The shots are not widely scattered, but are off-center from the target.
- The Pm index is good: the machine is accurate (low variation).
- However, the Pmk index is poor: the centering is misaligned, and the machine is producing parts that are out of tolerance.
Scenario 2: The shots are scattered, and several are off-target, even though they are centered.
- The Pm index is poor: the machine lacks precision, and many of the parts produced are out of tolerance.
- The Pmk index is also poor, despite the mean being correctly centered on the nominal value.
Scenario 3: The shots are tightly grouped and centered on the target.
- Both the Pm and Pmk indices are good: the machine is both accurate and well-calibrated. It produces only conforming parts.
Process capability or performance: the operational reality
Once the machine’s performance has been approved, the entire process must be analyzed, taking into account the actual variability of the terrain:
- multiple operators,
- multiple batches of material,
- different environmental conditions.
Process capability indices (Cp, Cpk) or performance indices (Pp, Ppk) are used to assess whether, under actual production conditions, the process is capable of producing parts that meet the specified tolerances.
Ideally, the process capability/performance is equivalent to that of the machine. In practice, it is often lower due to additional sources of variation (the other 4 Ms of the Ishikawa diagram).
Prerequisites to check
Before conducting any process capability study, two prerequisites must be verified:
1. The statistical stability of the process
A process must be stable in order for its performance to be predictable over time. This stability is verified using control charts (e.g., mean/range).
Depending on whether the process stability has been demonstrated or not, different capability indices are used, based on a different calculation of the standard deviation.
- For a stable process, the Cp and Cpk indices are used, with the standard deviation estimated from the mean of the range.
- For a process whose stability has not been demonstrated, the Pp and Ppk indices are used, with the overall standard deviation (STANDARD_DEV in Excel).
However, without stability, any conclusion regarding capability is fragile and potentially misleading.
2. The Law of Data Distribution
Capability indices are based on an assumption about the data distribution. It is therefore necessary to identify the most representative distribution (normal or otherwise), which will also allow us to estimate the proportion of production that meets the specified tolerances.
In the case of a normal, centered distribution:
- The ±3-sigma interval around the mean covers approximately 99.73% of the production.
- The more centered the process is, the closer the Cpk (or Ppk) is to the Cp (or Pp), and ideally, the Cpk (Ppk) is equal to the Cp (or Pp).
However, not all characteristics follow a normal distribution; for example, geometric characteristics (roundness, flatness, etc.) or shape defects often have an asymmetric or bounded distribution.
In such cases, ISO 22154 recommends a quantile-based approach, which allows for the direct assessment of the proportion of conforming items without assuming a normal distribution.
Interpretation of the indicators (in the case of a stable and normal process)
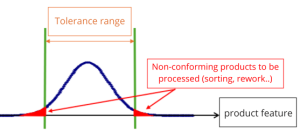
- Cp < 1
The process is not in control; part of the production is out of tolerance.
This results in sorting or rework costs before delivery to the customer. Corrective actions are needed to reduce variability.
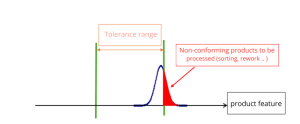
- Cp > 1.33 but Cpk < 1
The process variation is acceptable, but because the process is off-center, some of the output is out of tolerance. A realignment is necessary
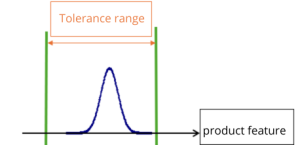
- 1.33 ≤ Cp, Cpk < 1.67
The process is generally considered robust. However, this may not be sufficient for critical characteristics. Indeed, in the case of a normal distribution, a Cpk of 1.33 corresponds to 63 ppm (parts per million) of nonconforming parts.
- Cp, Cpk ≥ 1.67
For a normal distribution, a Cpk of 1.67 corresponds to 0.6 ppm, and a Cpk of 2 corresponds to 0.002 ppm, which is appropriate for safety characteristics.
More than just calculations: a true management tool
Capability studies are not merely a statistical exercise. They serve as an operational tool for:
- Prioritize improvement initiatives,
- Identify high-risk processes,
- Estimate the costs of non-quality,
- Ensure the success of production launches,
- Foster objective communication with customers.
Mapping capabilities at the industrial site level allows resources to be effectively directed toward the most critical processes.
This shift moves us from a reactive approach (correcting defects) to a proactive approach (controlling variations).
Why get training?
Capability and performance indices may seem simple at first glance, but their rigorous implementation and interpretation require a true mastery of the subject. Understanding these analyses provides a powerful tool for continuous improvement.
Our training course #352, based on the ISO 22514 standard, aims to:
- Understand the fundamental statistical principles underlying capability and performance studies.
- Understand the prerequisites for calculating and using capability and performance indices.
- Be able to conduct capability and performance studies in accordance with the principles of ISO 22514: conditions for conducting the studies and calculations.
- Be able to interpret the results.
- Be able to prepare an analysis report.
📞 Une question ? Nos équipes sont à votre écoute et votre service pour répondre à vos besoins :
- France : +33 (0)2 51 13 13 00 – service.clients@euro-symbiose.fr
- Maroc : +212 (0)6 91 00 06 46 – service.clients@euro-symbiose.ma
